The Flag Fight: IHG and Wyndham Post 6%+ U.S. RevPAR, and the Brands Are Coming for Each Other’s Hotels
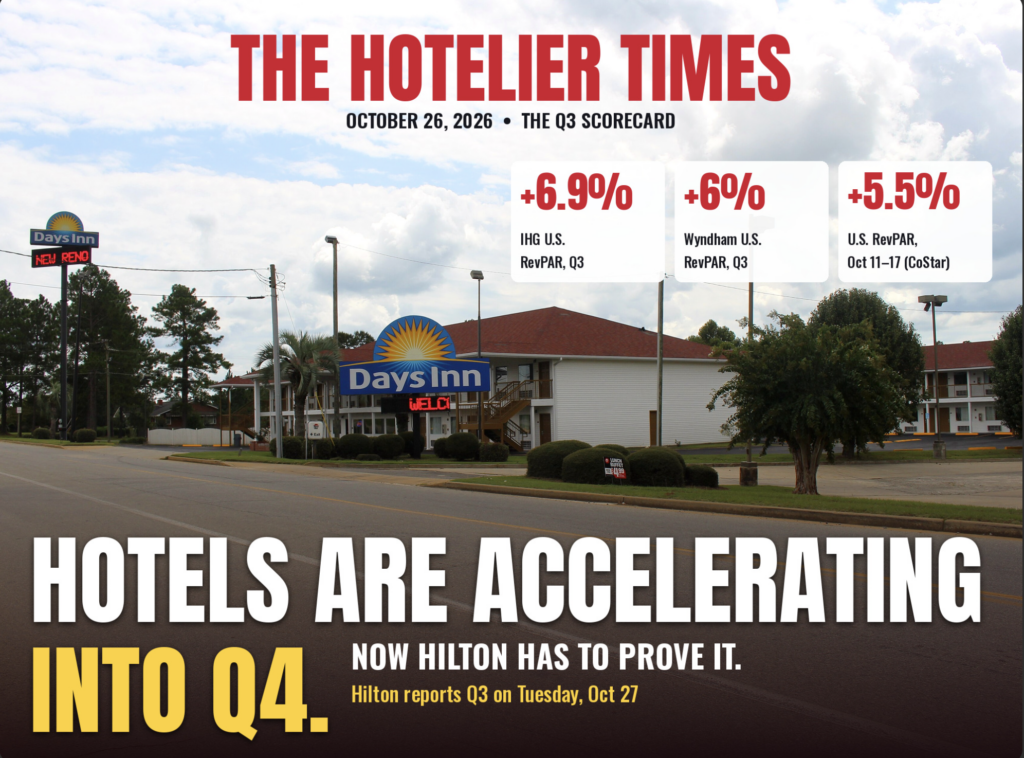
The first Q3 reports are in, and U.S. hotels beat: IHG’s U.S. RevPAR rose 6.9% and Wyndham’s rose 6%. Read past the headline, though, and the owner story is a flag fight. The brands are growing by signing hotels away from each other, and your franchise agreement is what they are fighting over.
On Oct. 17, in our Q3 earnings preview, we asked whether the gap between upscale and economy brands would keep widening. In the second quarter, Wyndham’s U.S. RevPAR grew 2% and Hilton’s grew 5.4%. Now the first answers are in. Wyndham reported on Oct. 21 and held its call on Oct. 22. IHG and Accor reported on Oct. 22. Hilton reported before the market opened on Tuesday, Oct. 27.
The short version: the economy end of the market caught up. Wyndham’s U.S. RevPAR jumped from +2% in the second quarter to +6% in the third, to $58.35. IHG’s U.S. RevPAR rose 6.9%.
The Scorecard
| Company | Q3 RevPAR | What else stood out |
|---|---|---|
| IHG | U.S. +6.9%; Americas +6.8%; global +5.3% | Americas occupancy up 2.1 points to 73.9% |
| Wyndham | U.S. +6% (to $58.35); global +2% (constant currency) | Full-year adjusted EBITDA outlook raised to $740M–$745M |
| Accor | Group +4.9%; Americas +6.5% (mostly Brazil) | Revenue €1,503M, +7.7% at constant currency |
| Hilton | System-wide +5.8%; U.S. +7.0% | Adj. EBITDA $1,058M; adj. EPS $2.45; FY RevPAR guide raised to 4.0%–4.5% |
IHG’s 5.3% global figure beat the 4.4% consensus the company had compiled, Reuters reported. CFO Michael Glover said on IHG’s earnings call, Hotel Dive reported, that the tail end of the World Cup added about 40 basis points to U.S. RevPAR growth, and that occupancy of 73.9% was the highest since 2017. Every segment grew in IHG’s Americas rooms revenue: groups +12%, leisure +7%, business +6%.
The industry data agree. CoStar’s numbers for the week of Oct. 11–17 showed U.S. RevPAR up 5.5%, to $125.53, on occupancy of 70.7%. Wyndham said its October month-to-date U.S. RevPAR was “relatively consistent with third-quarter results.”
A few caveats. Wyndham’s adjusted EBITDA of $207 million fell 3% as reported; it rose 5% only on a comparable basis. And the strength is American. Wyndham’s international RevPAR fell 3% and China’s fell 10%. IHG’s Greater China RevPAR fell 3.3%, and its six Gulf (GCC) markets fell 12%.
“A Flight to Quality”: IHG’s Conversion Machine
Here is the line in IHG’s release that owners should read twice. In the Americas, “in 2026 to date, conversions overall now represent around 50% of openings and 60% of signings.”
Where do those hotels come from? Mostly from other brands, CEO Elie Maalouf said on IHG’s trading-update call, Skift reported. “You can call it a flight to quality in these times, but we think we’re benefiting from it,” he said. Per Skift, IHG’s conversion-friendly brands voco and Garner have grown their Americas system size by 39% and 83% so far this year.
Globally, IHG signed 164 hotels (21,100 rooms) in the quarter. Its pipeline stands at 353,000 rooms across 2,426 hotels, up 3.2% from a year earlier. Analysts’ consensus for IHG’s 2026 net unit growth has moved up to about 4.8%, Skift reported.
When a brand says 60% of its new deals are existing hotels, mostly from rival flags, its growth plan runs through hotels like yours.
Wyndham’s Flip Side: Fewer Sales, More Terminations
Wyndham shows the other side of the same coin. On the call, CEO Geoff Ballotti said economy and midscale buy-sell transactions fell “over 30%… to historic all time lows,” which “temporarily widened that bid ask spread.” Many conversions happen when a hotel sells, so fewer sales means fewer flag changes for Wyndham to win.
At the same time, Wyndham is pruning. Its U.S. system shrank 1% from a year earlier, to about 500,000 rooms, and economy rooms fell 3%. U.S. deletions so far this year total 24,500 rooms, against 18,900 a year earlier. Management said most removals came from the “termination of substandard rooms,” and that U.S. openings carry a FeePAR premium “of more than 45% over terminations.” Wyndham trimmed its net rooms growth outlook to about 4%, from 4.0%–4.5%, while its pipeline hit a record of about 264,000 rooms.
Two more numbers matter to franchisees. Wyndham’s average U.S. royalty rate was 4.7% in the quarter, against 4.8% a year earlier. And on the rival economy brands launched in recent years, Ballotti said that since 2023 “less than 1% of our system has switched over to those brands.”
Your Flag Is a Free Agent
Put the two reports side by side and you get the owner’s lesson for this earnings season. One brand is winning hotels from its rivals. Another is losing low-performing rooms on purpose and waiting for the sales market to reopen. Both are telling you the same thing: the existing hotel is the prize.
That gives you leverage, but only at the right moment. The moment is when your franchise agreement comes up for renewal, or when you sell and the buyer chooses the flag. In our breakdown of what owners really pay a brand, the royalty was only half the bill. A competing brand that wants your hotel can move the other half: key money, a fee ramp, a cap on the PIP.
There is a flip side. Wyndham’s termination numbers are a reminder that brands are also cutting hotels that fall below standard. If your scores are weak, your renewal may be a negotiation about a PIP, not about incentives.
Why the Stocks Fell Anyway
Good numbers did not mean a good week for hotel stocks. IHG’s shares slipped about 1% after it forecast a $40 million to $60 million increase in 2027 interest costs, Reuters reported. Reuters summed up the sector’s mood this way: “Wars, civil unrest, high airfares and elevated borrowing costs cloud the general outlook.”
For owners, the borrowing-cost warning is the one to watch. If an asset-light franchisor is flagging higher interest bills for 2027, your lender is doing the same math on your loan. We covered that in The Refi Clock.
Hilton Reports: RevPAR Beat and a Higher Full-Year Bar
Hilton reported third-quarter results before the market opened on Tuesday, Oct. 27. Against the bar it set in its July 28 second-quarter release (system-wide comparable RevPAR up about 4.0%, adjusted EBITDA of $1,035 million to $1,055 million, and diluted EPS adjusted for special items of $2.28 to $2.34), the company beat:
- System-wide comparable RevPAR up 5.8% (currency neutral); U.S. RevPAR up 7.0%
- Adjusted EBITDA of $1,058 million, and diluted EPS adjusted for special items of $2.45
- Full-year RevPAR guidance raised to 4.0% to 4.5% (from 3.0% to 3.5%); full-year adjusted EPS guidance raised to $9.07 to $9.13 (from $8.89 to $9.01); net unit growth still 6.0% to 7.0%, with management pointing to the midpoint
U.S. RevPAR of 7.0% kept pace with IHG’s 6.9%. CEO Christopher Nassetta said the company delivered its highest quarter ever for organic openings and expects sequential growth in net room additions in the fourth quarter. Hilton kept its net unit growth range at 6.0% to 7.0% and said it expects to land around the midpoint. The release did not break out conversions as a share of openings. Hyatt follows on Thursday, Oct. 29, and Marriott and Choice on Monday, Nov. 2.
What This Means for Your Hotel
- Pull your franchise agreement. Note the term-end date, the liquidated damages formula and any PIP-on-transfer clause, especially if you might sell in the next 24 months.
- Measure what your brand delivers. Know your loyalty share of occupancy and your total brand fees as a percentage of room revenue. Compare them with our 12 percent flag math and the franchise fee table before a rival brand calls.
- If a rival approaches you, get it in writing. Ask for key money, a fee ramp and a PIP cap. Model the cost of switching (liquidated damages plus PIP) against three years of expected lift.
- Read Hilton’s beat as a conversion signal. U.S. RevPAR of 7.0% and a raised full-year RevPAR guide mean brands that need more rooms will keep pitching owners. Watch how Hilton talks about conversions on the call replay.
- Use the pace to set 2027 rates. Wyndham says October is running in line with the third quarter. Push your 2027 rate floors now, while the data back you up.
The Bottom Line
The first Q3 reports say U.S. hotel demand is accelerating, at the economy end as well as the top. But the more useful signal for owners is how the brands are growing: by taking each other’s hotels. That makes your flag a negotiable asset at renewal and at sale. Know your dates, know your numbers, and read Hilton’s beat — U.S. RevPAR up 7.0%, full-year guide raised — as a sign of how hungry the next brand rep will be.
Quotes from Wyndham’s call come from a published transcript.
Sources and further reading
- IHG 2026 Third Quarter Trading Update — IHG via Investegate, 2026-10-22
- IHG reports Q3 RevPAR growth driven by ‘strength of US economy’ — Hotel Dive, 2026-10-22
- IHG says it’s winning hotels from rival brands — Skift, 2026-10-22
- Holiday Inn owner IHG beats revenue estimates on resilient US travellers — Reuters via Euronext, 2026-10-22
- Wyndham Hotels & Resorts Reports Strong Third Quarter Results — Wyndham, 2026-10-21
- Wyndham posts Q3 US RevPAR gains amid ‘healthier’ demand trends — Hotel Dive, 2026-10-22
- Wyndham Hotels (WH) Q3 2026 earnings call transcript — The Motley Fool, 2026-10-22
- Accor Q3 2026 revenue release (PDF) — Accor, 2026-10-22
- U.S. hotel results for week ending 17 October — CoStar
- Hilton Reports Third Quarter Results — Hilton, 2026-10-27
- Hilton Reports Second Quarter Results (prior Q3 and full-year outlook) — Hilton, 2026-07-28
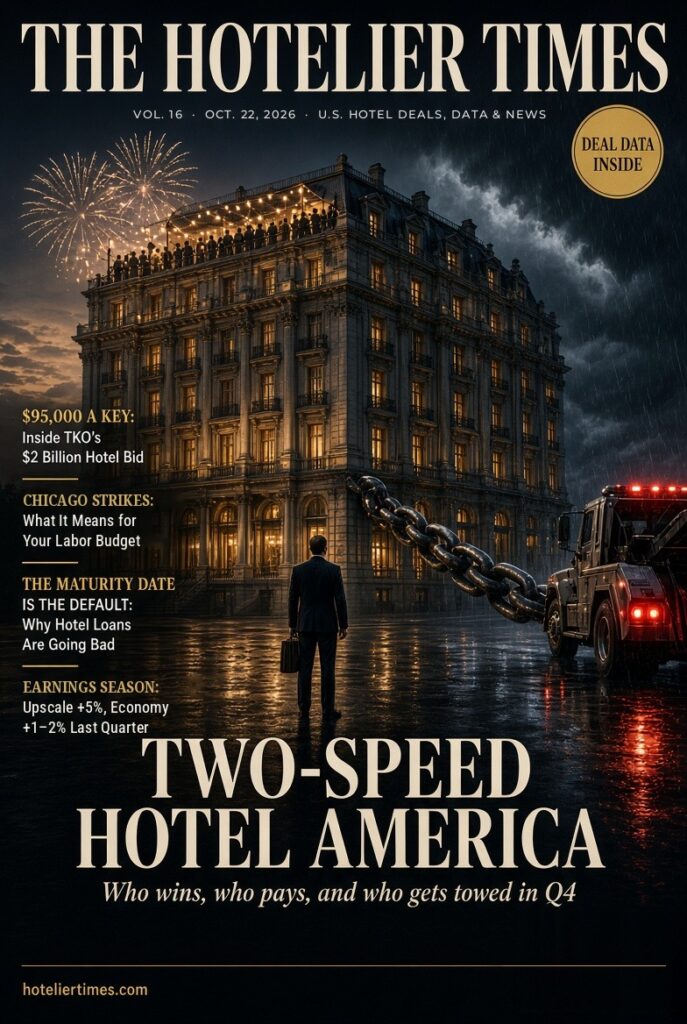
- Two-Speed Hotel America: What to Watch in Q3 Hotel Earnings — The Hotelier Times, 2026-10-17
- The 12 Percent Flag: What Owners Really Pay a Brand in 2026 — The Hotelier Times, 2026-10-12
Comments
No comments yet. Start the conversation.